Overview
The team had plenty of data and not enough signal. Operators were scanning multiple reports, exporting CSVs, and using chat threads to understand whether a metric required action or simple observation.
Problem
The previous dashboard treated every number as equally important. That made the interface feel complete but not useful under time pressure. Interviews showed that teams wanted to know what changed, why it changed, and who should act.
Approach
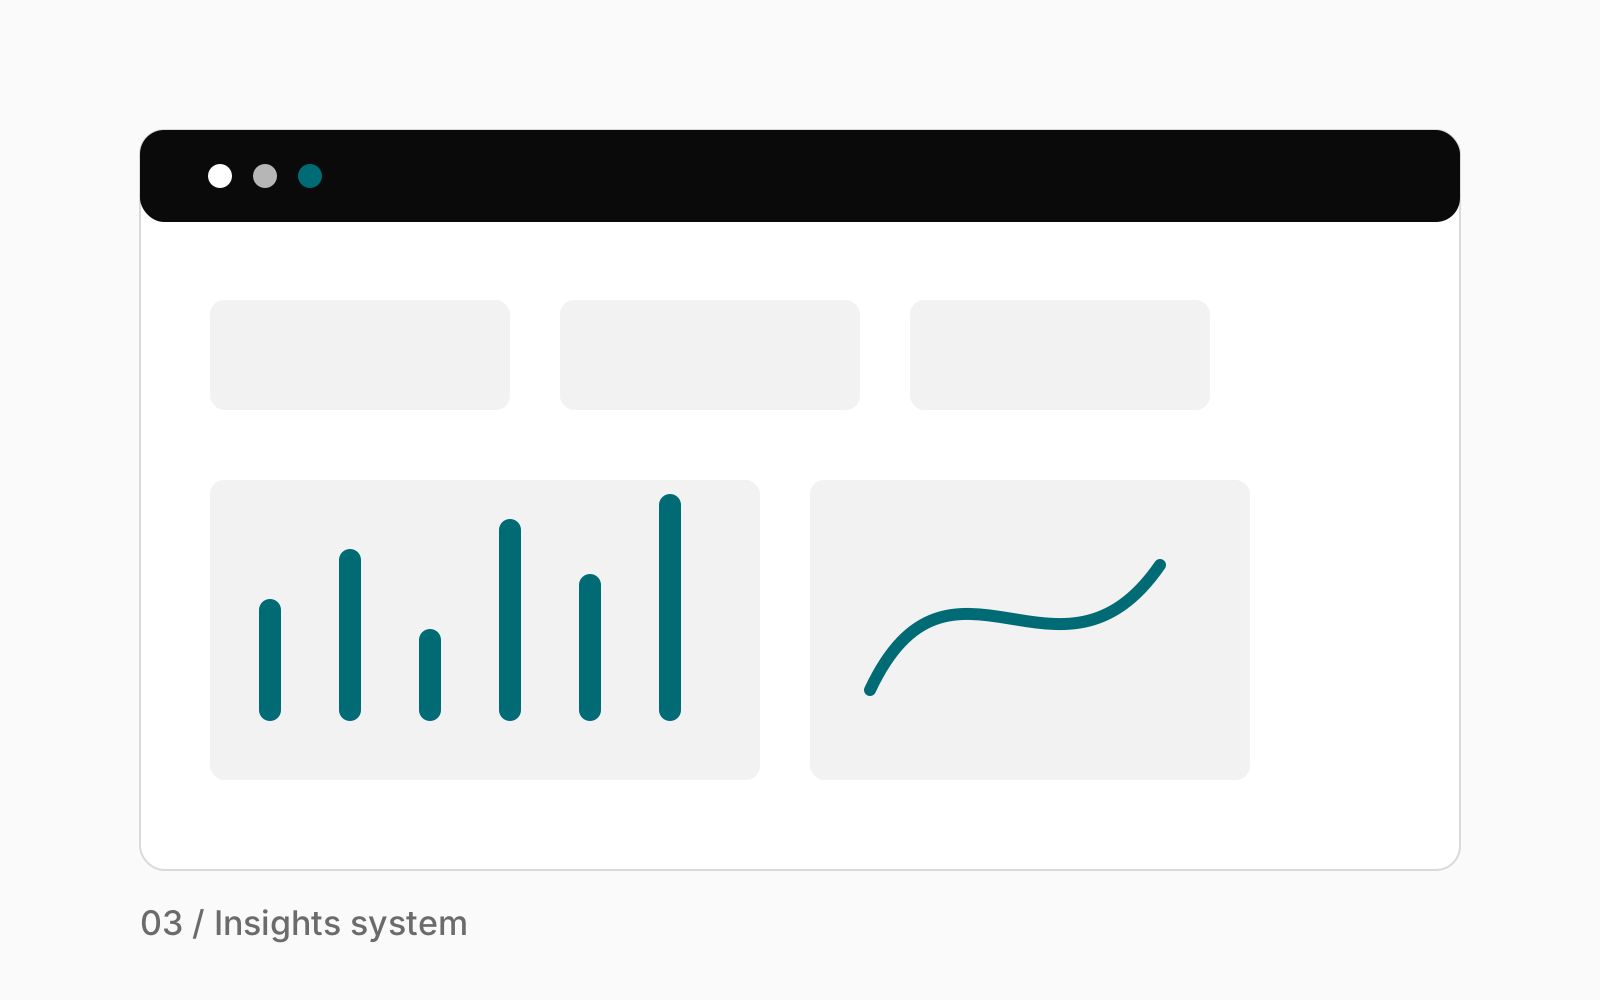
I introduced a hierarchy that separated stable business context from live operational risk. Summary cards answered whether attention was needed, while detail panels explained which segment, time window, and workflow had moved.
Before: a flat table made every metric compete for attention.
After: grouped signals let teams move from status to diagnosis.
Outcome
The new dashboard gave the team a shared triage surface. It also created reusable chart, filter, and empty-state patterns that could carry into adjacent analytics views without a fresh design pass.